
Mobile commerce isn't catching up to desktop anymore. It passed it. In 2026, mobile accounts for 60% of all global e-commerce sales and is on track to generate $2.4 trillion in revenue. If your store isn't built for phone-first shoppers, you're leaving real money behind.
We pulled together 42 mobile commerce statistics covering market size, conversion rates, payment trends, and regional breakdowns. Every stat is sourced and linked.
Hear what AI support calls sound like for your store. Just paste your Shopify URL and get sample calls in under 20 seconds, no email required. Listen to demo calls for my store.
Key highlights
- The global mobile commerce market is projected at $2.4 trillion in 2026, growing at a 9.5% CAGR through 2034. (Fortune Business Insights)
- Mobile now drives 60% of all e-commerce sales worldwide. (Statista)
- Shopping apps convert at 3.5% vs just 2% on mobile web. (Droids on Roids)
- Digital wallet users will hit 5.2 billion globally by 2026. (Capital One Shopping)
- Mobile cart abandonment sits at 80%, compared to 66% on desktop. (Baymard Institute)
- On Black Friday 2025, 70% of all sales came from mobile devices. (Productsup)
Market size and growth
1. The global mobile commerce market is projected at $2.4 trillion in 2026. It's expected to reach $5 trillion by 2034, growing at a 9.5% compound annual growth rate. (Fortune Business Insights)
2. Mobile commerce accounts for 60% of total global e-commerce sales. That share has grown steadily from 43% in 2018 and is projected to hit 63% by 2028. (Statista)
3. US mobile commerce is estimated at $410 billion in 2026. That number is expected to climb to $856 billion by 2027 as more American consumers shift to phone-first shopping habits. (Fortune Business Insights)
4. Mobile commerce grew roughly 20% between 2023 and 2025. That growth rate significantly outpaced desktop, which has been flat or declining in share for years. (Invesp)
5. 1.65 billion people are expected to shop via smartphone in 2026. That's about one-third of the global digital population making purchases from their phones. (Dataopedia)
The overall trend is clear. Mobile isn't just a channel anymore. For most ecommerce brands, it's the primary channel, and the gap keeps widening.
Mobile traffic and user behavior
6. Mobile drives 78% of global e-commerce traffic. But it only accounts for 66% of orders, showing there's still a conversion gap between browsing and buying on phones. (SQ Magazine)
7. 4.8 billion people worldwide own a smartphone. That's 59% of the global population. And a growing share of those users are comfortable buying directly from their devices. (Statista)
8. Users spend over 90% of their smartphone time in apps. Less than 6% goes to browsers and search apps. That's a massive signal for brands thinking about where to invest in mobile experiences. (Mobiloud)
9. 70% of consumers use their phones to make online purchases. Only 23% use their computers. The default shopping device for most people is the one in their pocket. (inBeat Agency)
If you're running a Shopify store and most of your traffic is already mobile, think about the full experience. That includes what happens when a customer picks up the phone to call you. AI phone agents can handle those calls 24/7, even at 2 AM on a Saturday. See how it works for your store.
Mobile app vs mobile web performance
10. Shopping apps convert at 3.5%, nearly double the 2% rate of mobile websites. Apps deliver a faster, more personalized experience that keeps users in a buying mindset. (Droids on Roids)
11. Cart abandonment in apps is just 20%, compared to 97% on mobile web. That's the single biggest performance difference between apps and mobile browsers. (Droids on Roids)
12. App users view 286% more products per session than mobile web users. Engagement runs much deeper in apps, which translates directly into higher average order values. (Mobiloud)
13. 54% of mobile transactions happen inside apps, not mobile browsers. And that number is growing as more retailers invest in native app experiences. (SQ Magazine)
14. 70% of mobile purchases now occur via apps rather than mobile websites. Progressive Web Apps (PWAs) are bridging some of the gap by offering app-like speed without requiring a download. (The Retail Exec)
For Shopify store owners, these numbers make a strong case for investing in your mobile experience. Even without a native app, optimizing your mobile checkout flow can close a lot of the conversion gap.
Conversion rates and average order value
15. The average mobile ecommerce conversion rate has reached 2.8% in 2026. That's finally matching desktop, up from the 1.8% mobile average that persisted for years. (ConvertCart)
16. Desktop orders average $155 compared to $112 on mobile. That $43 gap represents billions in potential revenue if brands can improve the mobile purchasing experience. (Red Stag Fulfillment)
17. Food and beverage leads mobile conversion rates at 6.11%. On the other end, luxury goods convert at just 1.19% on mobile, reflecting longer research cycles for high-ticket items. (ConvertCart)
18. AR shopping experiences drive up to 94% higher conversion rates. Letting shoppers visualize products in their space before buying removes a major friction point on mobile. (ConvertCart)
19. Mobile cart abandonment sits at 80%, compared to 66.4% on desktop. The top reason? Extra costs like shipping and taxes that surface late in checkout. (Baymard Institute)
20. E-commerce retailers lose roughly $18 billion annually to abandoned carts. With mobile being the dominant traffic source, fixing mobile cart abandonment is one of the highest-ROI moves you can make. (Email Vendor Selection)
The conversion rate parity between mobile and desktop is a major shift. But the AOV gap tells you there's still room to grow. Better mobile UX, transparent pricing, and faster customer support all push that number higher.
Digital wallets and mobile payments
21. Digital wallet users will reach 5.2 billion globally by 2026. That's over 60% of the world's population using a digital wallet for payments. (Capital One Shopping)
22. Digital wallets account for 53% of global online purchases. They also handle 32% of in-store transactions, making them the dominant payment method across channels. (Capital One Shopping)
23. Apple Pay is projected to exceed 780 million global users by end of 2026. In the US alone, 67 million people (23.3% of the population) will use Apple Pay. (Capital One Shopping)
24. QR code payments hit 380 billion transactions globally in 2026. That's over 40% of all digital wallet transactions by volume. (CoinLaw)
25. Gen Z leads mobile wallet adoption at 70%. Millennials follow at 61%, Gen X at 40%, and Boomers at 22%. (Capital One Shopping)
26. The global digital wallet market is growing at a 28.3% CAGR. It's projected to reach $51.5 billion in total market value. (CoinLaw)
If your checkout doesn't support Apple Pay, Google Pay, or Shop Pay, you're adding friction that kills conversions. The younger your customer base, the more critical this becomes.
Mobile commerce by region
27. Asia-Pacific contributes over 55% of global mobile commerce revenue. The region has the highest smartphone penetration and the most mature mobile payment ecosystems. (Wiser Review)
28. South Korea leads the world with mobile commerce at 77% of e-commerce sales. No other country comes close to that level of mobile-first shopping behavior. (Statista)
29. Southeast Asia is the fastest-growing e-commerce region at 18.6% growth. The region is on track to hit $230 billion in gross merchandise value by 2026. (Charle Agency)
30. European mobile commerce will reach $471 billion by 2026. Growth is slower than Asia-Pacific at 7.9% CAGR, partly due to fragmented markets across languages, currencies, and payment preferences. (Fortune Business Insights)
31. North American mobile commerce is estimated at $593 billion in 2026. The US alone accounts for $410 billion of that figure. (Fortune Business Insights)
32. Indonesia, Singapore, and Brazil are the fastest-growing individual m-commerce markets. Growth rates of 52%, 48%, and 45% respectively are driven by rising smartphone adoption and improving mobile infrastructure. (Invesp)
For brands selling internationally, these numbers matter a lot. If you're targeting Asian markets, mobile-first design isn't optional. It's the entire game. And if your store gets calls from customers in 40 different languages, you need support that scales.
Social commerce and mobile shopping
33. Social commerce sales exceeded $1.17 trillion globally. That figure is growing at over 30% annually, faster than traditional e-commerce. (inBeat Agency)
34. Smartphones account for over 90% of social commerce transactions. Social shopping is inherently mobile, and the numbers confirm it. (inBeat Agency)
35. 80.4 million US users are expected to shop on TikTok by 2026. That's 67% of TikTok's American audience buying products directly through the app. (Hostinger)
36. US social commerce sales are projected to surpass $100 billion in 2026. That milestone puts social on par with many traditional retail channels. (Hostinger)
37. Video commerce accounts for over 40% of total social commerce activity. Live shopping and short-form video are the biggest drivers of impulse purchases on mobile. (inBeat Agency)
Social commerce is basically mobile commerce with a different entry point. When someone discovers your product on TikTok and buys it in two taps, their next question about shipping or returns will come through your support channels. Being ready for that is what separates brands that retain customers from brands that don't.
Holiday season and peak mobile shopping
38. On Black Friday 2025, 70% of all sales came from mobile devices. Mobile has become the default shopping device for the biggest retail event of the year. (Productsup)
39. 46.9 million consumers shopped via mobile on Cyber Monday 2025. That's up from 40.4 million in 2024, a 16% year-over-year jump. (Digital Commerce 360)
40. 79.4% of Buy Now Pay Later transactions on Cyber Monday occurred on mobile. BNPL passed $1 billion in a single day for the first time, and most of it happened on phones. (Adobe)
41. The 2025 holiday season drove a record $257.8 billion in online spending. Mobile's share of that total continues to climb year over year. (Adobe)
42. AI-driven traffic from generative AI to retail sites increased 670% year-over-year on Cyber Monday. Consumers are using AI tools on their phones to find deals, compare products, and make faster buying decisions. (Adobe)
Peak shopping seasons show what mobile commerce looks like when scaled to maximum intensity. If your store can't handle a surge in mobile orders, customer support calls, and payment processing during Black Friday, you're leaving revenue on the table.
What this means for ecommerce brands
The numbers tell a consistent story. Mobile is where your customers are, and the gap between mobile and desktop is only getting wider. Here's what matters most.
Optimize for mobile checkout first. With mobile conversion rates finally matching desktop at 2.8%, the biggest remaining gap is average order value ($112 mobile vs $155 desktop). Transparent pricing, saved payment methods, and one-tap checkout through digital wallets can close that gap. If you're on Shopify, enabling Shop Pay is one of the simplest wins.
Invest in the post-purchase mobile experience. Mobile shoppers don't stop after buying. They track orders, request returns, and ask questions from the same device they purchased on. And 58% of all customer support inquiries now come from mobile. Your support experience needs to match the buying experience.
Don't ignore phone support. This one surprises people. Even though mobile shoppers are digital-first, 76% of consumers still prefer phone calls when they need help. And here's the thing: if someone is already on their phone browsing your store, calling you is one tap away. That's why AI phone agents are becoming critical for ecommerce brands. They answer instantly, 24/7, in 40 languages, and they handle the routine stuff (order status, return policies, product questions) so your team can focus on complex issues.
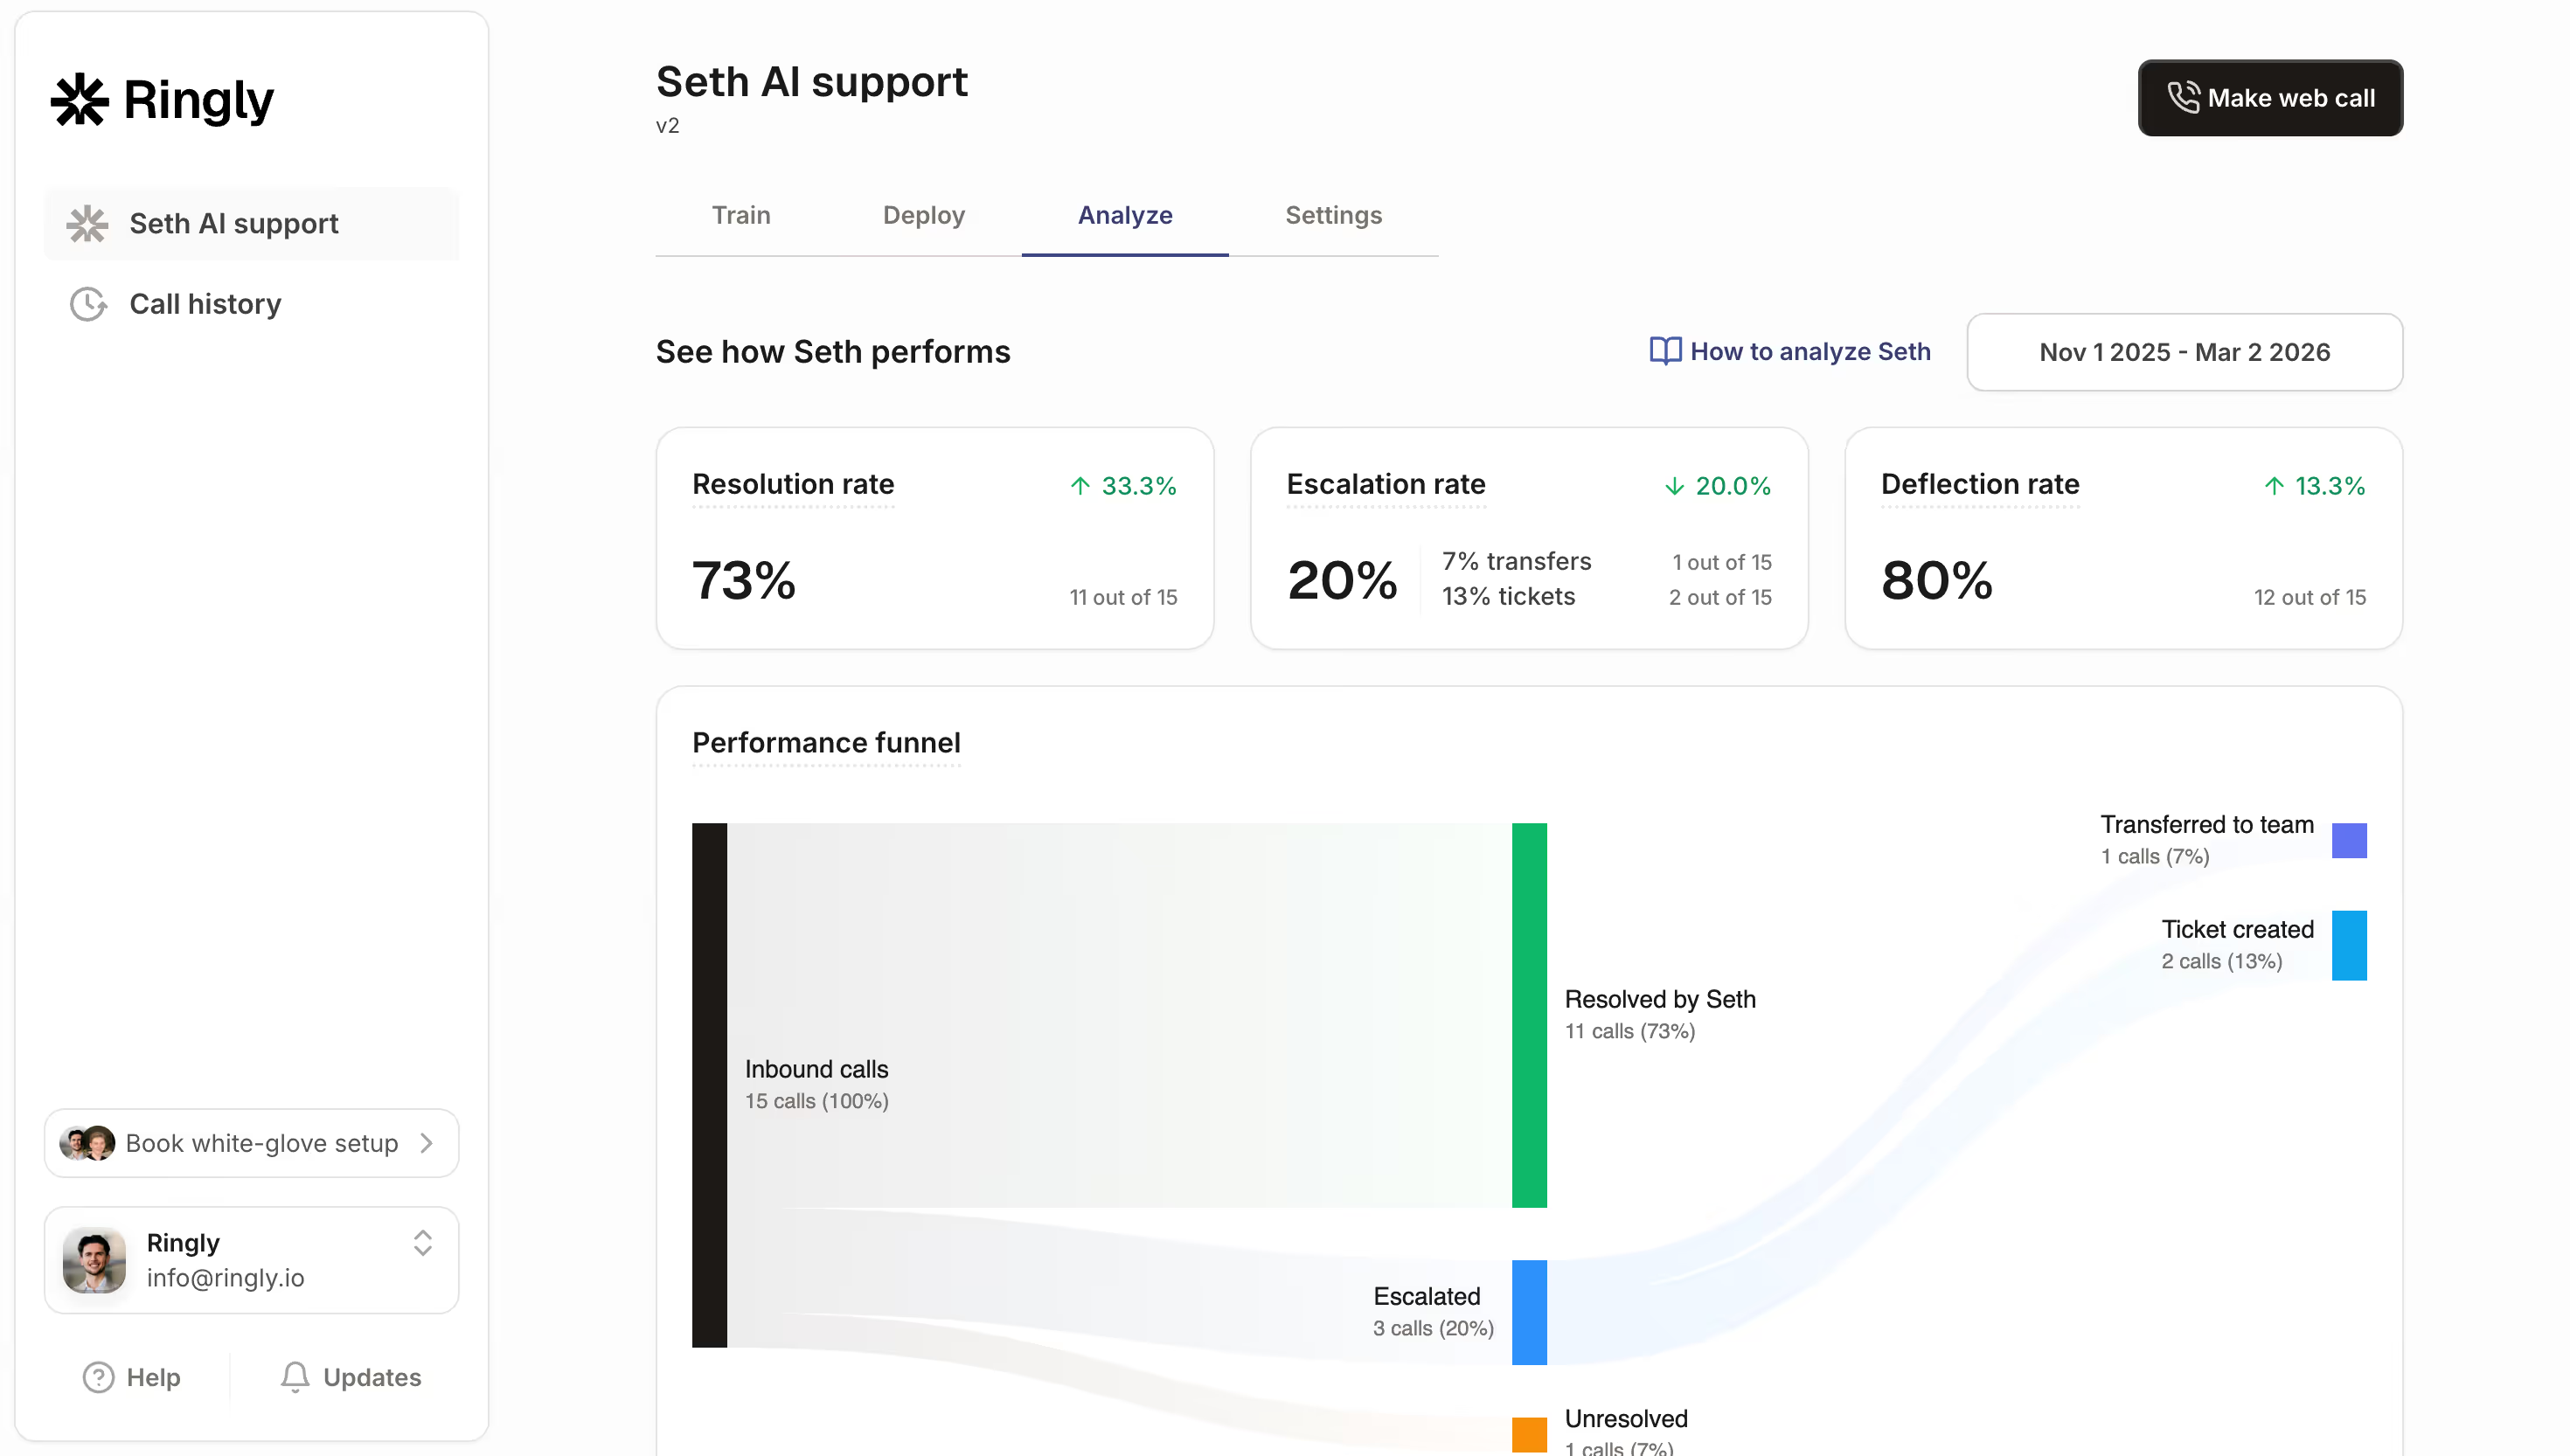
If you run a Shopify store, Ringly.io handles 73% of support calls automatically with AI. It looks up orders, processes returns, and answers product questions without your team lifting a finger. Try it free for 14 days. Setup takes about three minutes.
Frequently asked questions
What percentage of ecommerce sales come from mobile in 2026?
Mobile accounts for approximately 60% of all global e-commerce sales in 2026, according to Statista. In some markets like South Korea, that number reaches 77%. In the US, mobile's share is closer to 50% of total online sales.
How big is the mobile commerce market in 2026?
The global mobile commerce market is projected at $2.4 trillion in 2026, according to Fortune Business Insights. Some estimates that include different categories put the figure closer to $4 trillion. Either way, the market is growing at roughly 9.5% annually.
What is the average mobile conversion rate for ecommerce?
The average mobile ecommerce conversion rate has reached 2.8% in 2026, which now matches desktop. Shopping apps convert even higher at 3.5%. Industry matters too: food and beverage converts at 6.11% while luxury goods sit at 1.19%.
Why is mobile cart abandonment so high?
Mobile cart abandonment sits at about 80%, compared to 66% on desktop. The top reason is extra costs (shipping, taxes, fees) that appear late in checkout. Small screens, slow load times, and complicated checkout flows also contribute. Offering digital wallet payments and transparent pricing can bring that number down.
How many people use digital wallets in 2026?
Digital wallet users are projected to reach 5.2 billion globally by 2026, which is over 60% of the world's population. Apple Pay alone is expected to have 780 million users. Gen Z leads adoption at 70%, followed by Millennials at 61%.
What is the average order value on mobile vs desktop?
Desktop orders average $155 while mobile orders average $112. That $43 gap is one of the biggest opportunities in ecommerce. Brands that improve their mobile UX, offer personalized recommendations, and use upselling strategies can narrow it significantly.
Which regions lead in mobile commerce?
Asia-Pacific dominates with over 55% of global mobile commerce revenue. South Korea has the highest mobile share at 77% of e-commerce sales. Southeast Asia is the fastest-growing region at 18.6% growth. In absolute numbers, North America ($593 billion) and Europe ($471 billion) round out the top three.
How does social commerce relate to mobile commerce?
Social commerce is essentially a subset of mobile commerce, since over 90% of social commerce transactions happen on smartphones. The global market exceeded $1.17 trillion in 2025 and is growing at over 30% annually. In the US, 80.4 million users are expected to shop on TikTok by 2026.